 |  |
|---|---|
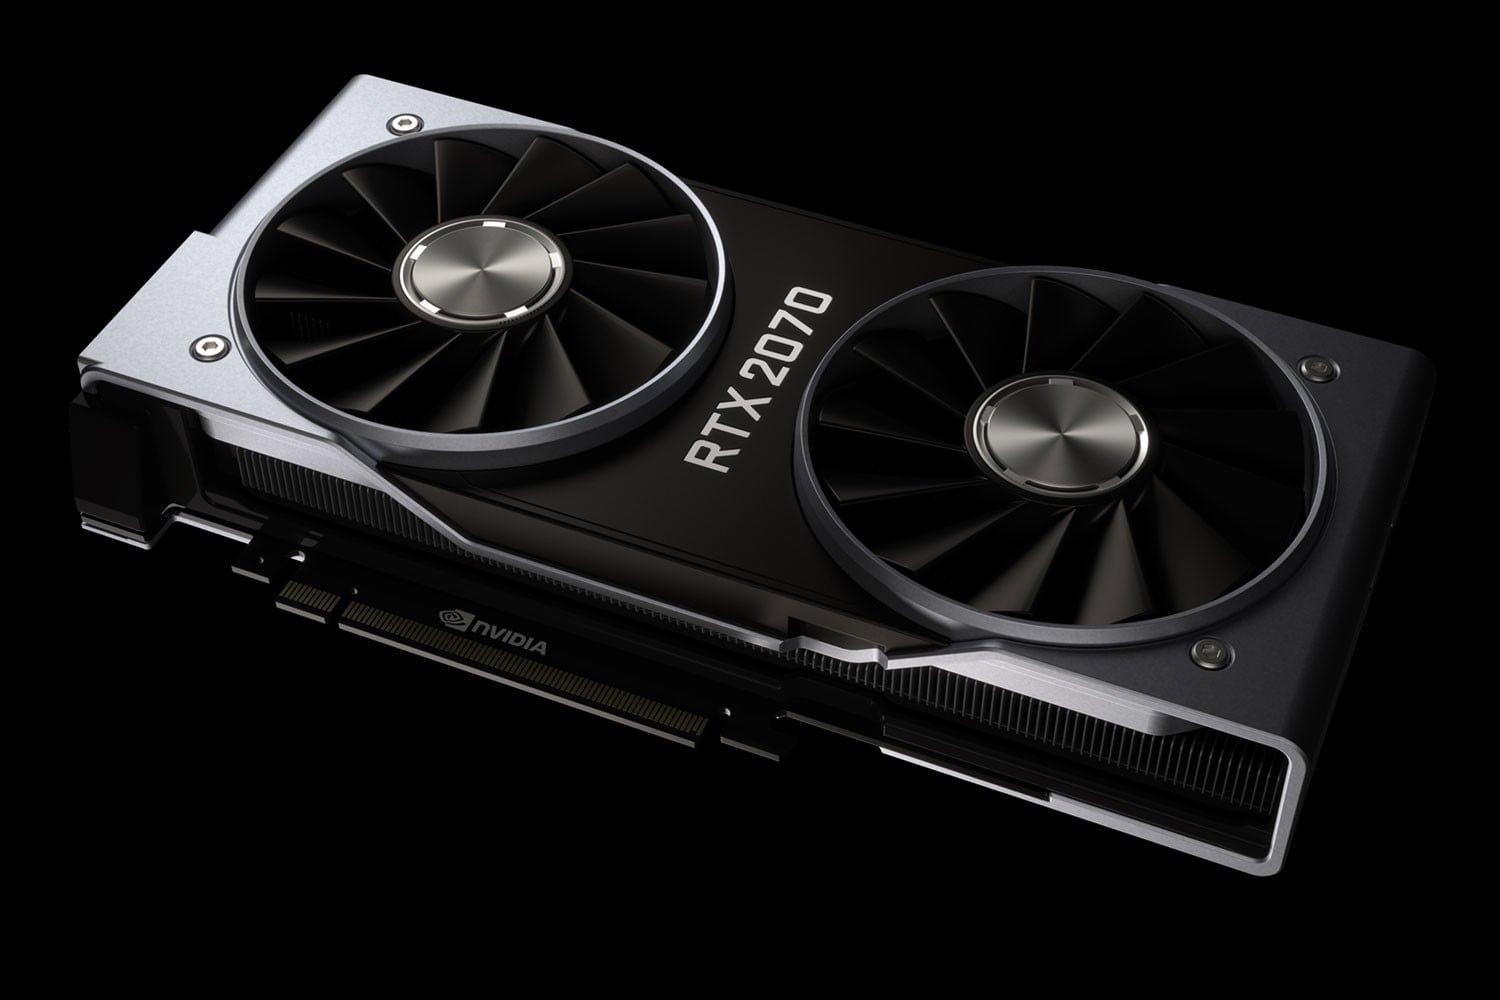
| Nvidia RTX 2080 | Nvidia RTX 2070 |
| BUY NOW | BUY NOW |
| PROS | PROS |
| Impressively improved gaming frame rates. The second most performant GPU in the world. Super simple overclocking. | Playable 4K gaming across a variety of titles. Impressive synthetic performance. Surprisingly lower energy consumption. |
| CONS | CONS |
| Nvidia’s most expensive xx80 card yet. Dips under 60 fps with some 4K games. More power demanding. | Expensive for a ‘mid-range’ GPU. RTX and DLSS-enabled games still not out yet. No SLI option. |
SPECIFICATIONS
| GPU ENGINE SPECS | RTX 2080 | RTX 2070 |
| NVIDIA CUDA Cores | 2944 | 2304 |
| Boost Clock (MHz) | 1710 | 1620 |
| Base Clock (MHz) | 1515 | 1410 |
| MEMORY SPECS | RTX 2080 | RTX 2070 |
| Memory Speed | 14 Gbps | 14 Gbps |
| Standard Memory Config | 8 GB GDDR6 | 8 GB GDDR6 |
| Memory Interface Width | 256-bit | 256-bit |
| Memory Bandwidth (GB/sec) | 448 GB/s | 448 GB/s |
| DISPLAY SUPPORT | RTX 2080 | RTX 2070 |
| Maximum Digital Resolution | 7680×4320 | 7680×4320 |
| Standard Display Connectors | DisplayPort 1.4, HDMI 2.0b | – |
| Multi Monitor | 4 | 4 |
| HDCP | 2.2 | 2.2 |
| DIMENSIONS | RTX 2080 | RTX 2070 |
| Height | 4.556” | 4.435” |
| Length | 10.5” | 9.0” |
| Width | 2-Slot | 2-Slot |
| THERMAL & POWER | RTX 2080 | RTX 2070 |
| Maximum GPU Temperature (in C) | 88 | 89 |
| Graphics Card Power (W) | 215W | 185W |
| Recommended System Power (W) | 650W | 550W |
NOTE – Things like clock speed and power will vary between specific cards, these are just the reference specs for each model.
The 2080 has more CUDA cores, higher base and boost clock speeds, so an improvement in most aspects, although the memory between them is the same. The 2070 also has no NVLink capability, while the 2080 does.
PERFORMANCE
GRAPHICS CARD USED:
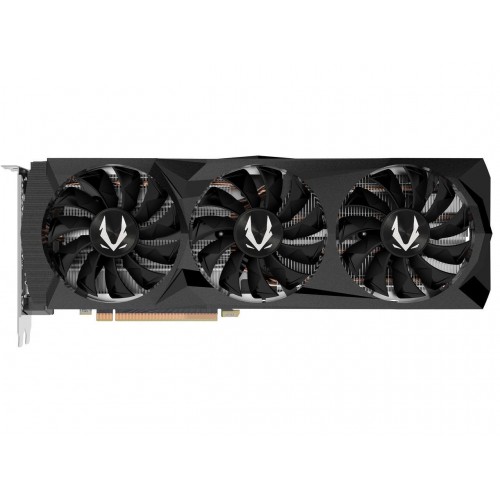
- NVIDIA RTX 2080 (ZOTAC AMP)
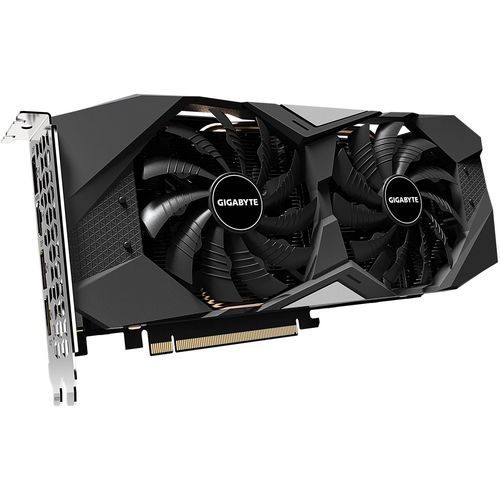
- NVIDIA RTX 2070 (Gigabyte WF OC)
SYSTEM SPECS:
- CPU: Intel Core i9-9900K
- COOLER: Corsair Hydro Series H100i V2
- MEMORY: G.SKILL 32GB Ripjaws V
- MOTHERBOARD: MSI Z390 Gaming
- POWER SUPPLY: EVGA 750W Gold (UPDATED)
- SSD: Samsung 970 PRO 500 GB
- OS: WINDOWS 10 PRO
Assassin’s Creed Odyssey
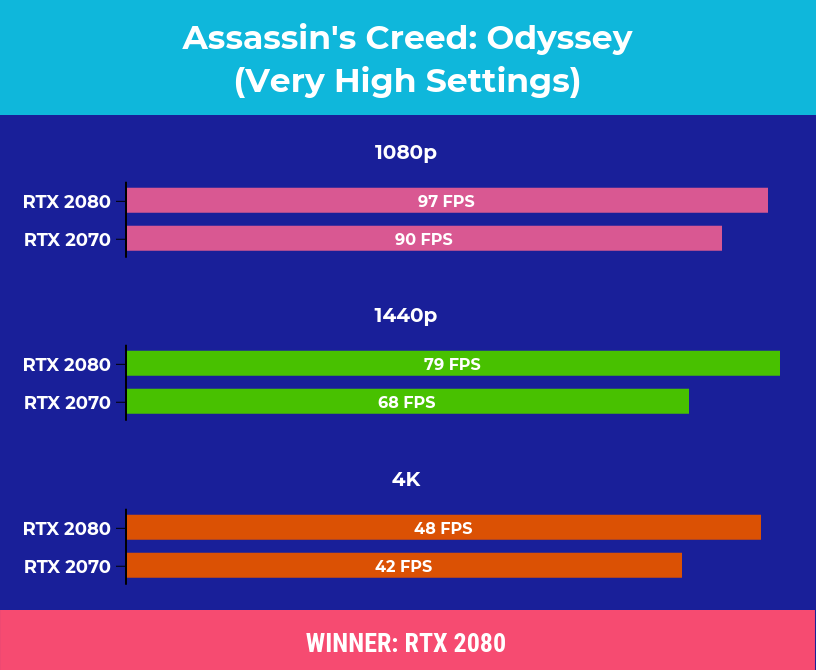
Assassin’s Creed Odyssey was tested with the built in benchmark using very high settings. At 1080p the 2080 is scoring 7.9% higher average FPS compared to the 2070. At 1440p the 2080 is now getting 13% higher average FPS, and then at 4K it’s performing 12.5% better.
Battlefield V
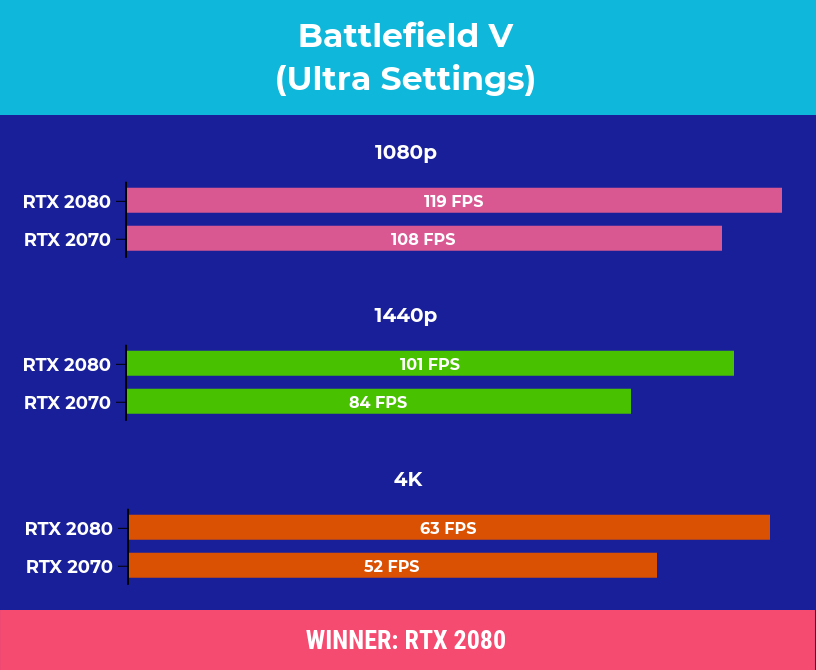
Battlefield 5 was tested in campaign mode rather than multiplayer, as it’s easier to consistently reproduce the test run, and it seems to be more graphically intensive. With the resolution set to 1080p at ultra settings the RTX 2080 was getting 9.2% higher average FPS when compared against the GTX 2070. At 1440p this rises to just above a 16% improvement, and then finally at 4K there was a slightly higher 17% improvement.
Destiny 2
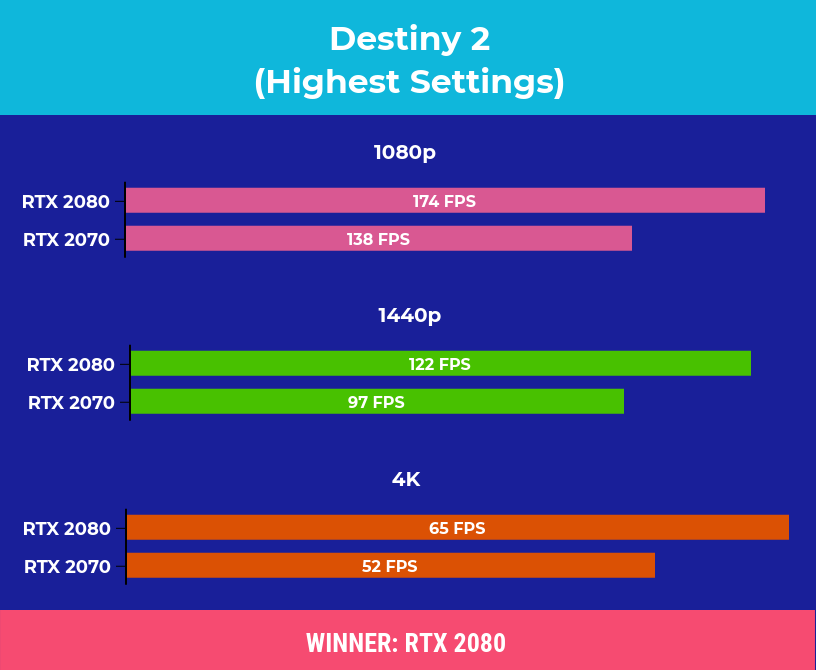
Destiny 2 was tested using the built in benchmark with highest settings. At 1080p the 2080 was getting 20% higher average FPS. With the resolution set to 1440p the 2080 was now getting 38% higher average FPS. Finally at 4K there was a similar improvement to averages, 20% with the 2080.
F1 2018
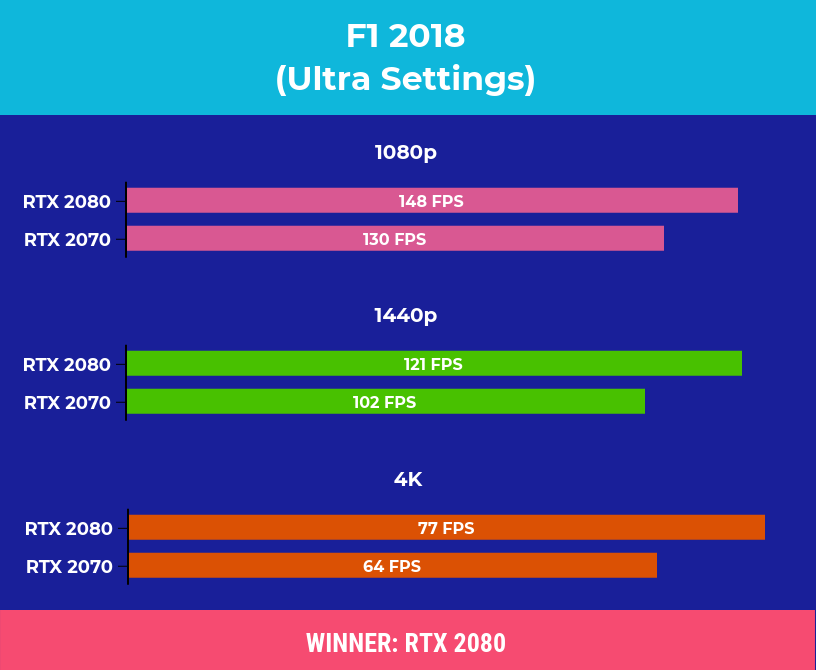
F1 2018 was also tested using the built in benchmark, and there were some fairly big gains in this test with the RTX 2080. At 1080p the 2080 was getting 12% higher average FPS, 15% higher average FPS at 1440p, and then 16% higher at 4K.
Far Cry 5
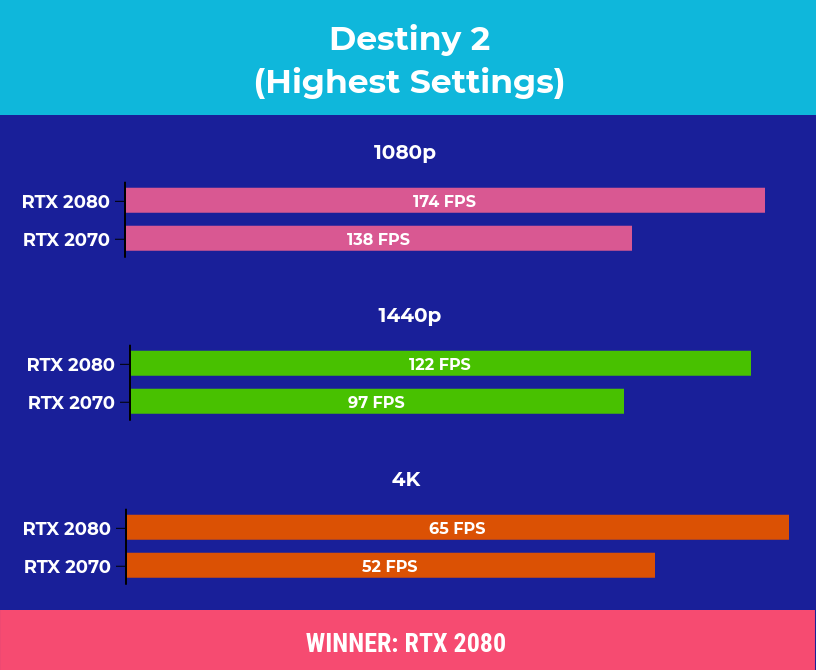
Far Cry 5 was tested using the built in benchmark at highest settings. I’ve found this game to favour RTX 2080. At all resolutions there was a 20% improvement to average FPS.
Fortnite
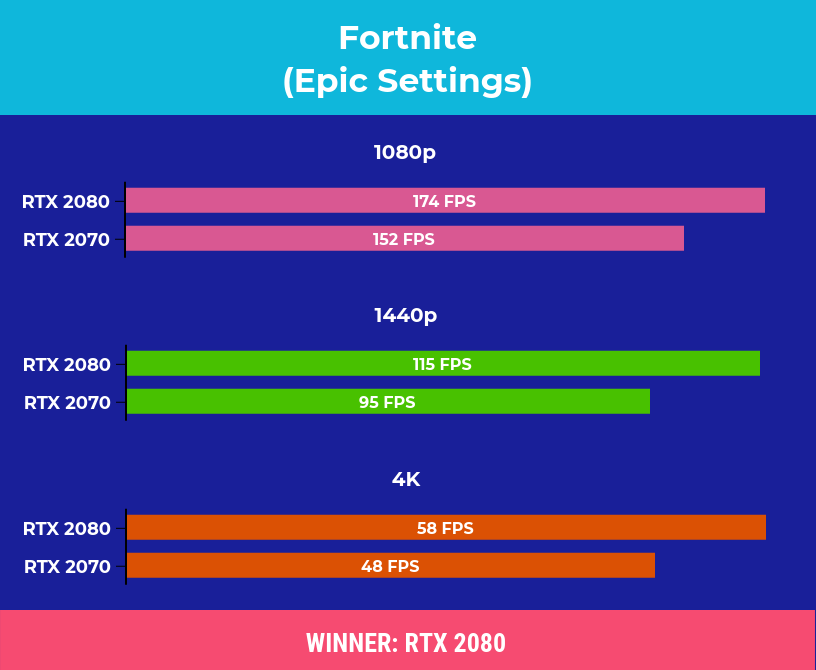
Fortnite was tested with the replay feature using the exact same replay with epic settings. At both 1080p there was a 12% increase to average FPS with the 2080 and 17% faster at 1440p and 4K.
Monster Hunter: World
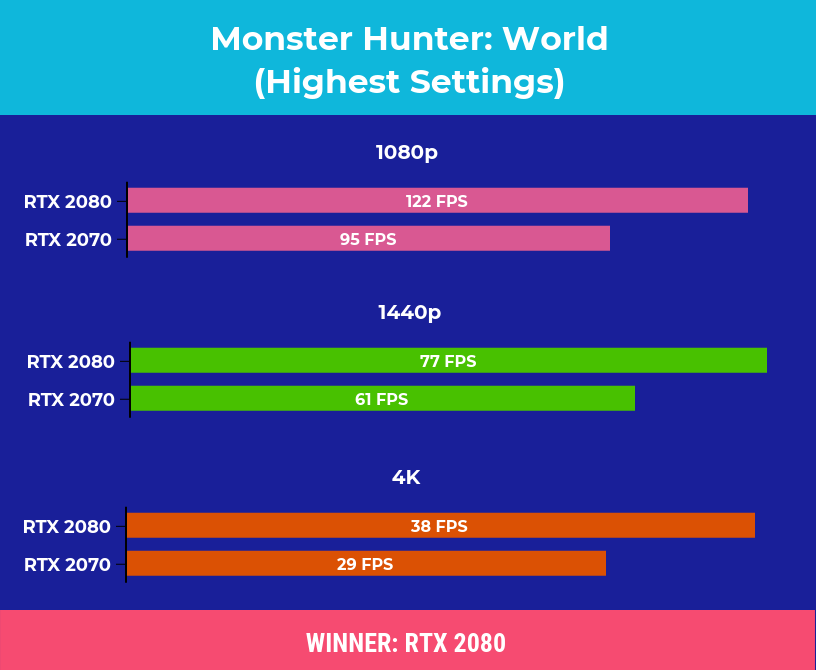
Monster Hunter: World was tested with the Ulletical FPS benchmark. Overall this game was in favor of RTX 2080. However, both the graphics card were not performing well at 4K.
PUBG
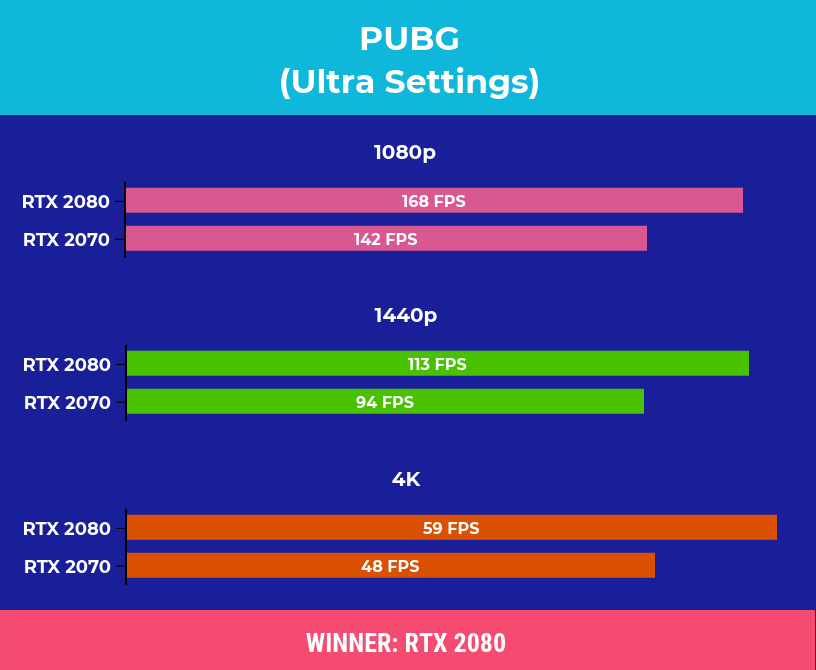
PUBG was tested using the replay feature with the exact same replay at ultra settings. At 1080p the RTX 2080 was getting 15% higher average FPS. Stepping up to 1440p sees a larger improvement with the 2080, now getting 16% higher average FPS. At 4K with the 2080 getting 18% higher.
Shadow of the Tomb Raider
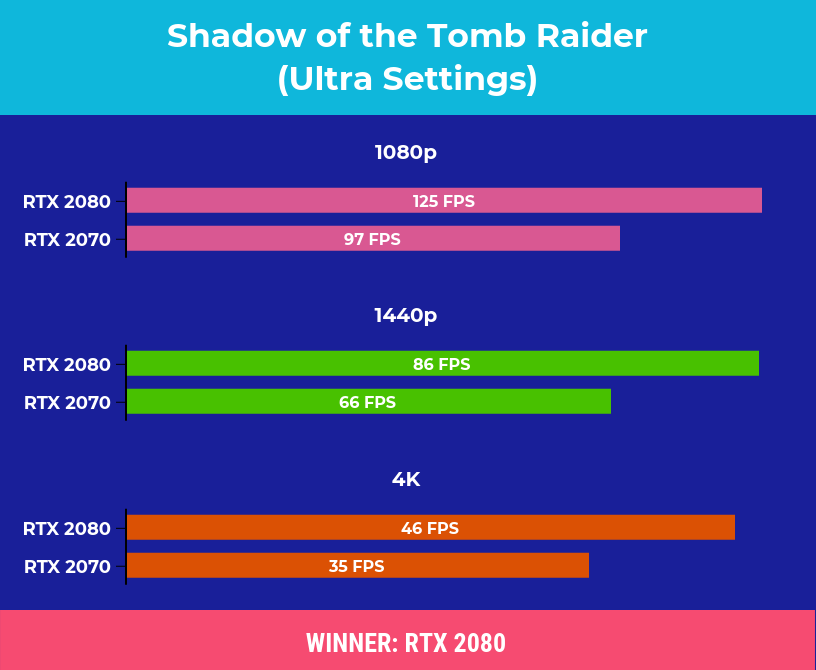
Shadow of the Tomb Raider was tested in the practice range as I can easily perform the same test run. At 1080p there was only a 22% improvement to the average frame rate, then the it was 23% ahead at 1440p and 4K.
Warhammer Vermintide 2
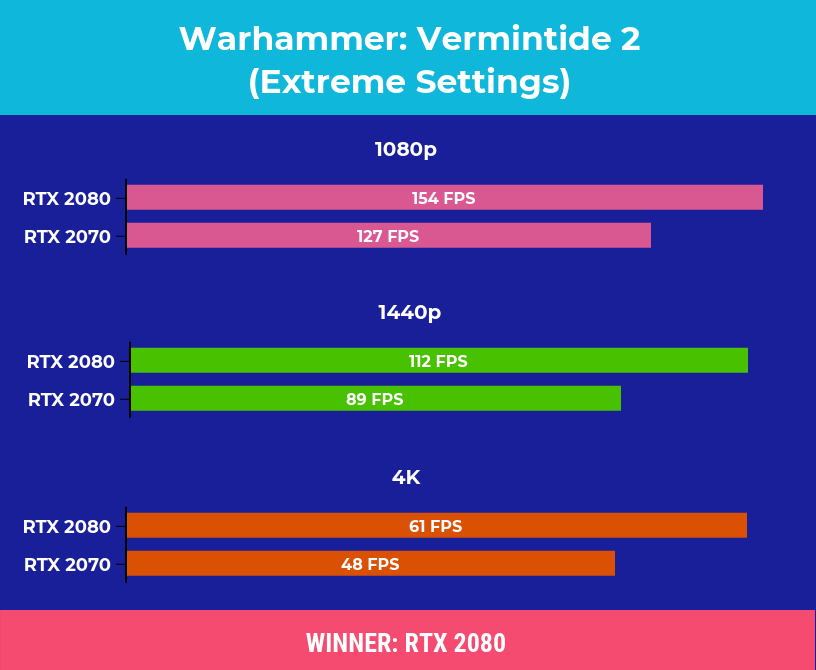
Warhammer Vermintide 2 is a resource intensive game, and I can play it alright with a solid 60 FPS, and I didn’t find it too bad even at 4K with very high settings on the 2080, though I would of course use lower settings to improve the frame rate. Anyway at 1080p the 2080 was 17% higher in terms of average FPS, and then 20.5% better at both 1440p and 4K.
CONCLUSION
I think for lower resolutions like 1080p, the 2080 is less worthwhile, as there was just a 10% average performance gain with the 2080, however for higher resolutions like 1440p and 4K the 2080 was giving 19% and 23% higher performance respectively. The 2080 can take you to a playable experience at 4K where the 2070 would be struggling. I think I’d pay more and just get the 2080 if I needed that level of power.
