 |  |
|---|---|
| RX 470 | GTX 1050 Ti |
| BUY NOW | BUY NOW |
| PROS | PROS |
| Great Full HD performance. Low power consumption. Plenty of memory for a sub-£200 card. | Handles all games at Full HD. Ridiculously low power consumption. Quiet design. |
| CONS | CONS |
| Priced too near the 4GB RX 480. | Some games need to be dropped to Medium settings. |
SPECIFICATIONS
| OVERVIEW | RX 470 | GTX 1050 Ti |
| Card Status | Released | Released |
| Manufacturer | AMD | NVIDIA |
| Release Date | 28th July, 2016 | 25th October, 2016 |
| Launch Price | $179 USD | $139 USD |
| GPU | RX 470 | GTX 1050 Ti |
| GPU Model | 14nm Ellesmere PRO | 14nm GP107-300 |
| Cores : TMUs : ROPs | 2048 : 128 : 32 | 768 : 48 : 32 |
| MEMORY | RX 470 | GTX 1050 Ti |
| Memory Size | 4096 MB GDDR5 | 4096 MB GDDR5 |
| Memory Bus Width | 256-bit | 128-bit |
| Memory Bandwidth | 211.2 GB/s | 112 GB/s |
| PHYSICAL | RX 470 | GTX 1050 Ti |
| Interface | PCI-Express 3.0 x16 | PCI-Express 3.0 x16 |
| Thermal Design Power | 120 W | 75 W |
| CLOCKS | RX 470 | GTX 1050 Ti |
| Base Clock | 926 MHz | 1291 MHz |
| Boost Clock | 1206 MHz | 1392 MHz |
| Memory Clock (Effective) | 1650 (6600) MHz | 1750 (7000) MHz |
| Computing Power (FP32) | 3,793 GFLOPS | 1,983 GFLOPS |
PERFORMANCE
GRAPHICS CARD USED:
- MSI RX 470 4GB Armor (Adrenalin Edition 17.12.2)
- Gigabyte GTX 1050 Ti Windforce (GeForce Graphic driver 388.71)
SYSTEM SPECS:
The system that I’m testing with has an AMD Ryzen 3 1200 CPU overclocked to 3.9GHz in an ASUS B350 Prime motherboard, along with 16GB RAM running at DDR4-3000 in dual channel.
LET’S GET INTO RESULTS.
Middle Earth Shadow of WAR
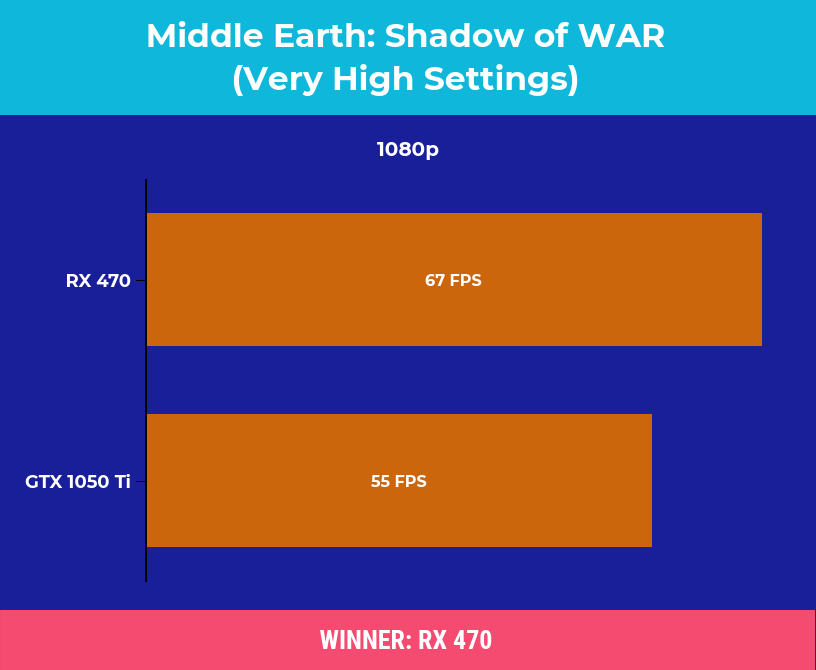
Let’s start out Middle Earth Shadow of WAR, which was tested with very high settings. In terms of average FPS the RX 470 was getting 17% higher at 1080p.
COD: WW2
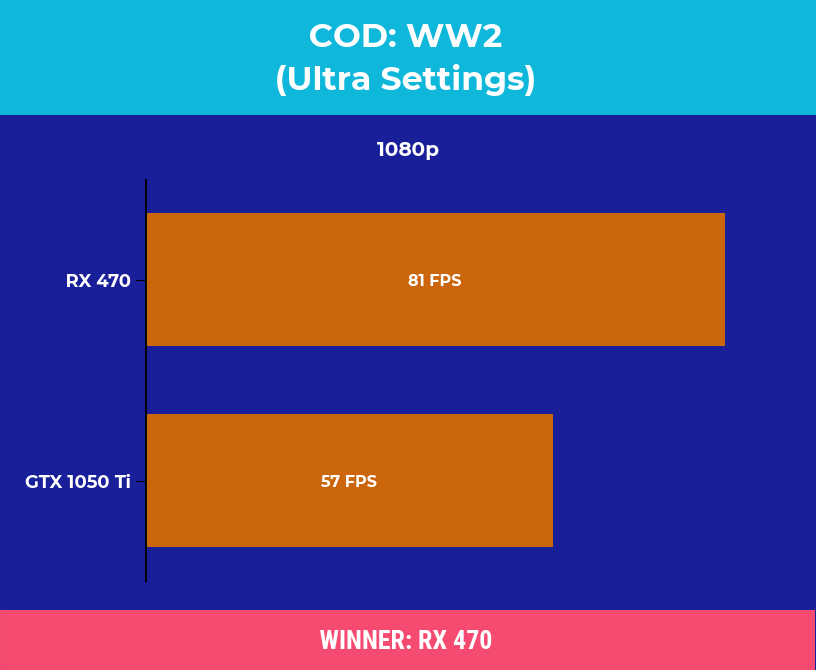
COD: WW2 was tested with the built in benchmark using ultra settings. At 1080p the RX 470 was 29% ahead of the 1050 Ti.
Star Wars Battlefront 2
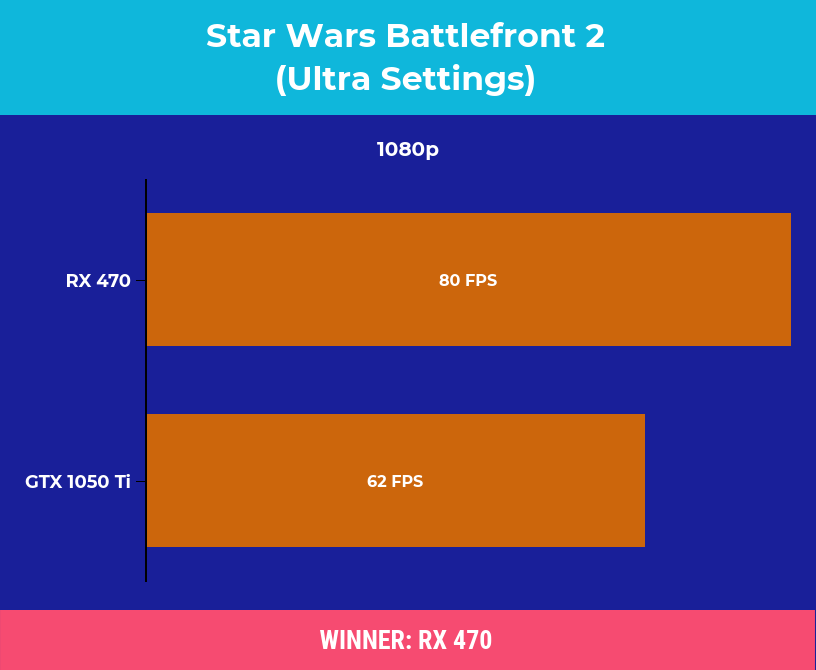
Star Wars Battlefront 2 was tested in campaign mode rather than multiplayer, as it’s easier to consistently reproduce the test run. The RX 470 was again getting a much better result. At 1080p, the RX 470 was 22% ahead of the 1050 Ti.
Destiny 2
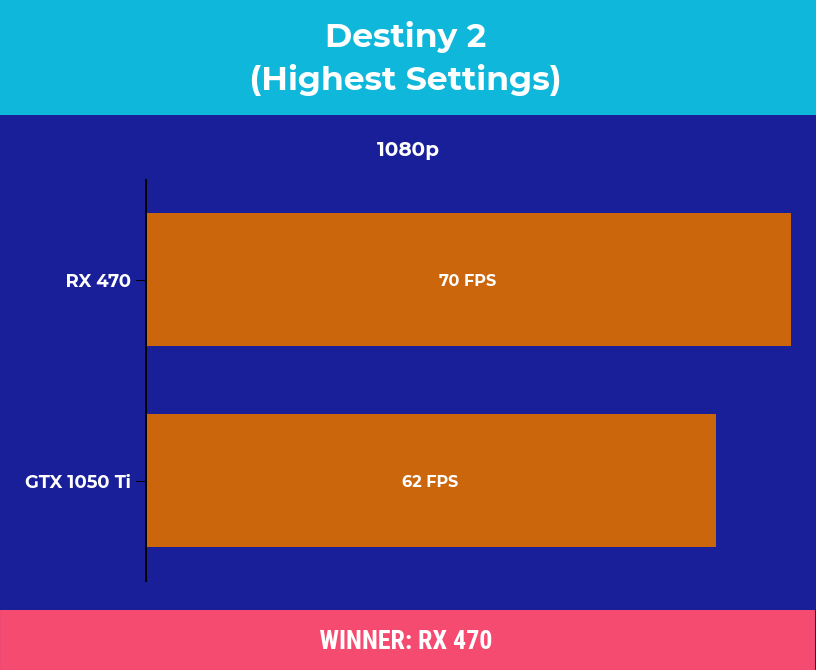
Destiny 2 was tested using the built in benchmark with highest settings, and we’re seeing a 11% performance boost with the RX 470 at 1080p.
Fortnite
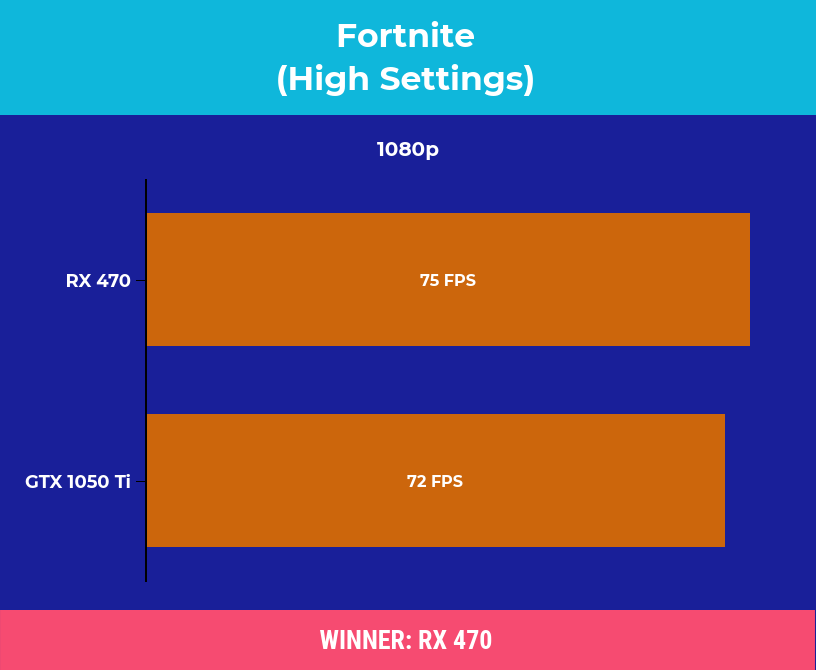
Fortnite was also tested using the built in benchmark with high settings. The results between the two cards are closer together. At 1080p the RX 470 was just 3FPS ahead.
Assassin’s Creed Origins
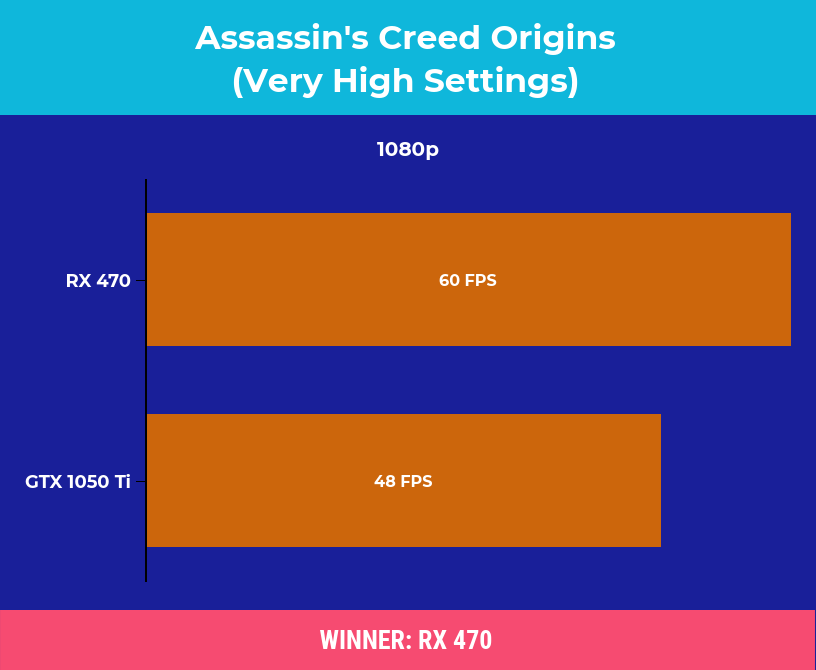
Assassin’s Creed Origins was tested using the replay feature with the exact same replay on both graphics cards, so as apples to apples as you can get in this game. At 1080p the RX 470 was 20% ahead of the average FPS from the 1050 Ti.
Kingdom Come: Deliverance
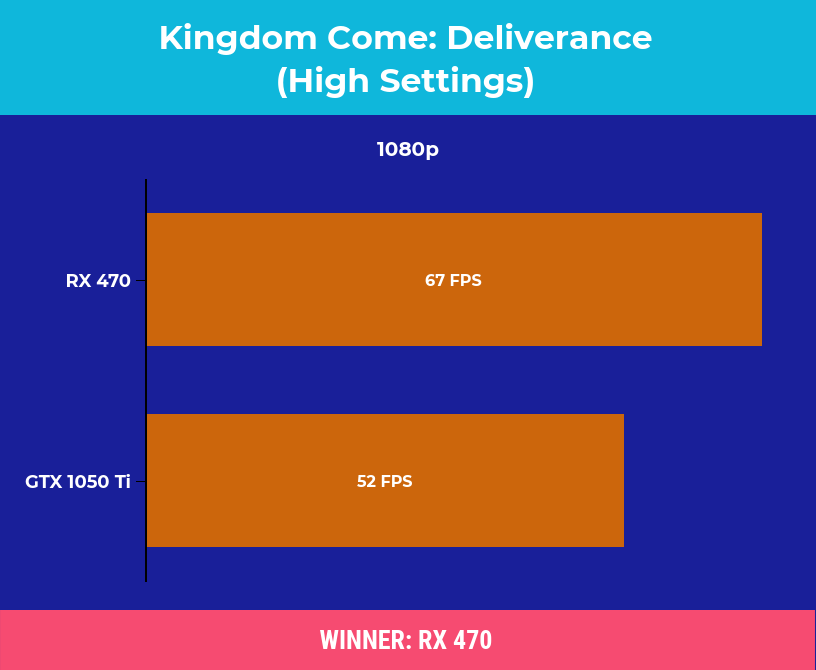
Kingdom Come: Deliverance was tested with the built in benchmark at high settings. Most parts of the game perform a fair bit better than this, so don’t take these results as a good indication of what to expect throughout the entire game, it’s more of a worst case, it does however allow me to perform an accurate comparison.
Warhammer: Vermintide 2
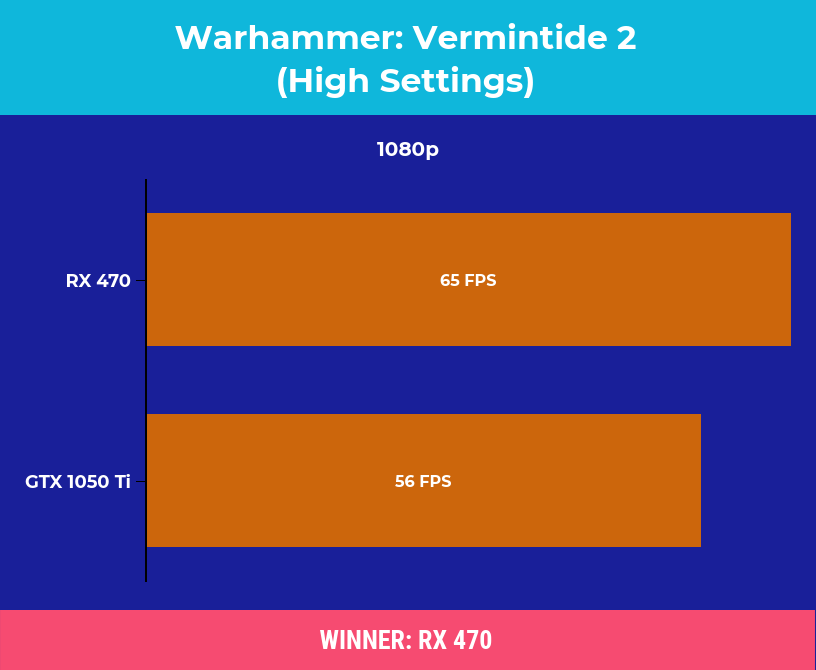
Warhammer: Vermintide 2 was also tested using the built in benchmark with high settings, and with a 1080p resolution the RX 470 was coming out 13% ahead of the 1050 Ti.
Far Cry 5
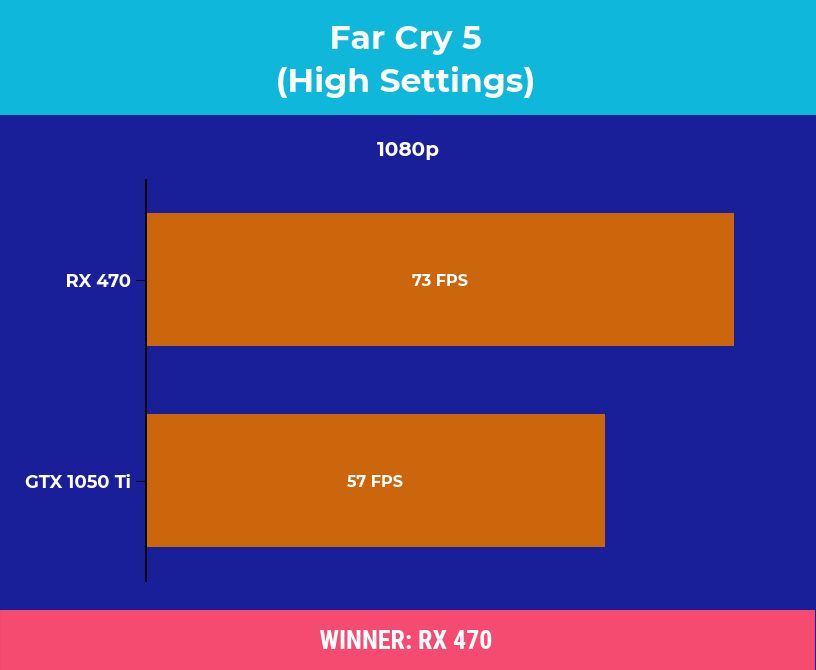
Far Cry 5 was tested using the built in benchmark at high settings. At 1080p we’re looking at a 21% improvement to average FPS with the RX 470 over the 1050 Ti.
Wolfenstein 2
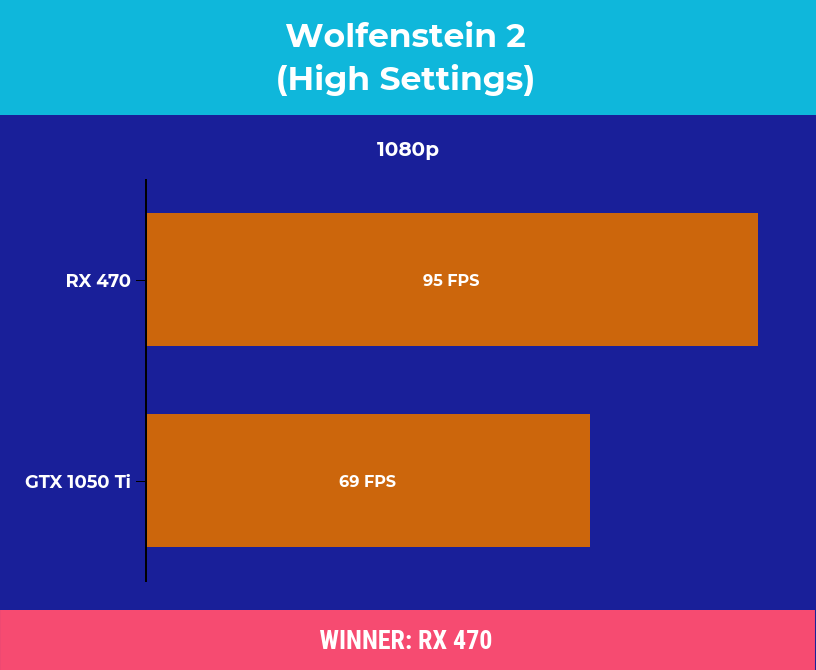
Wolfenstein 2 was tested with the Ulletical FPS benchmark. At 1080p there was a relatively low 31% increase to average FPS with the RX 470.
Evil Within 2
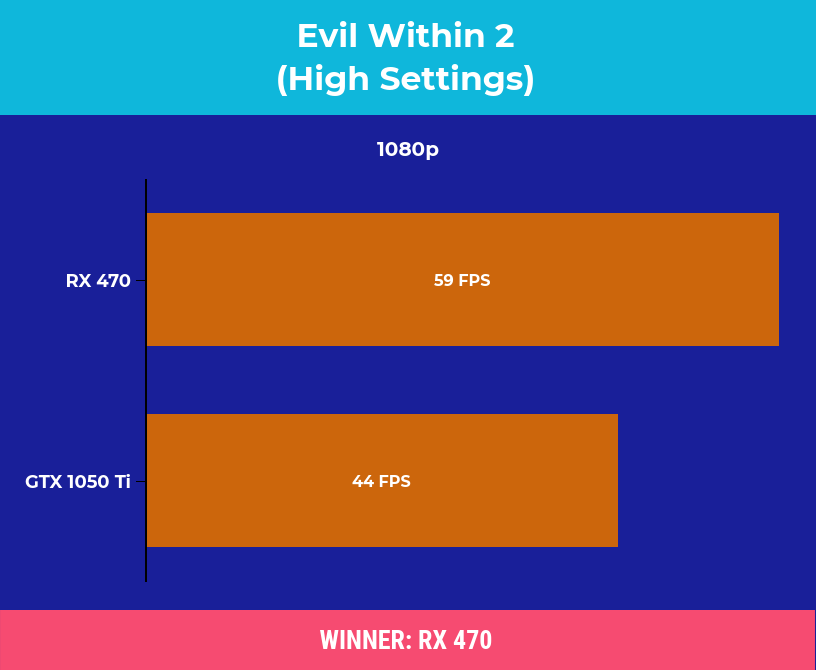
Evil Within 2 was tested in the practice range as I can easily perform the same test run compared to playing with bots or other players which will vary every time. At 1080p the RX 470 was reaching average frame rates 25% higher than the 1050 Ti.
Hellblade
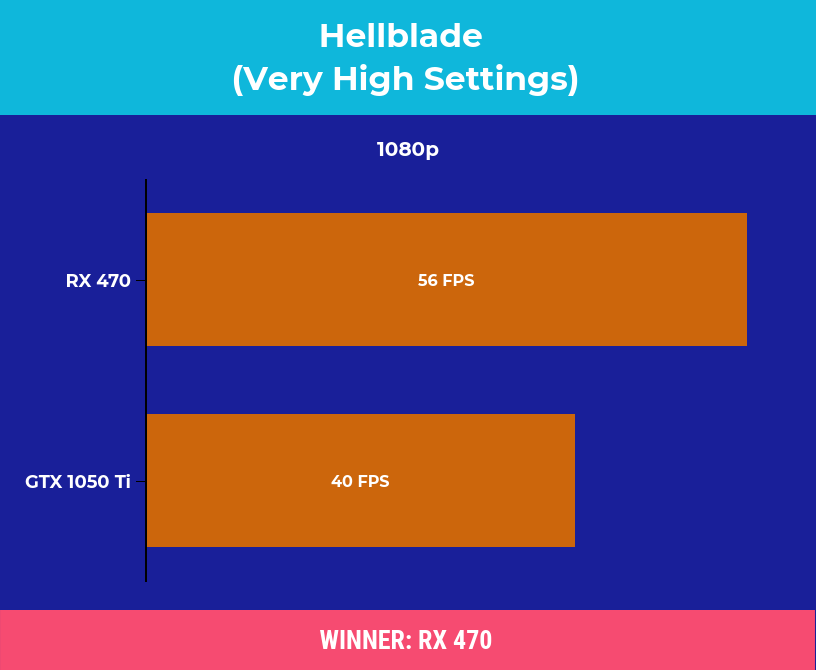
Hellblade was tested using the replay feature with the exact same replay at very high settings, and at 1080p the RX 470 was 25% ahead of the 1050 Ti.
Battlefield 1
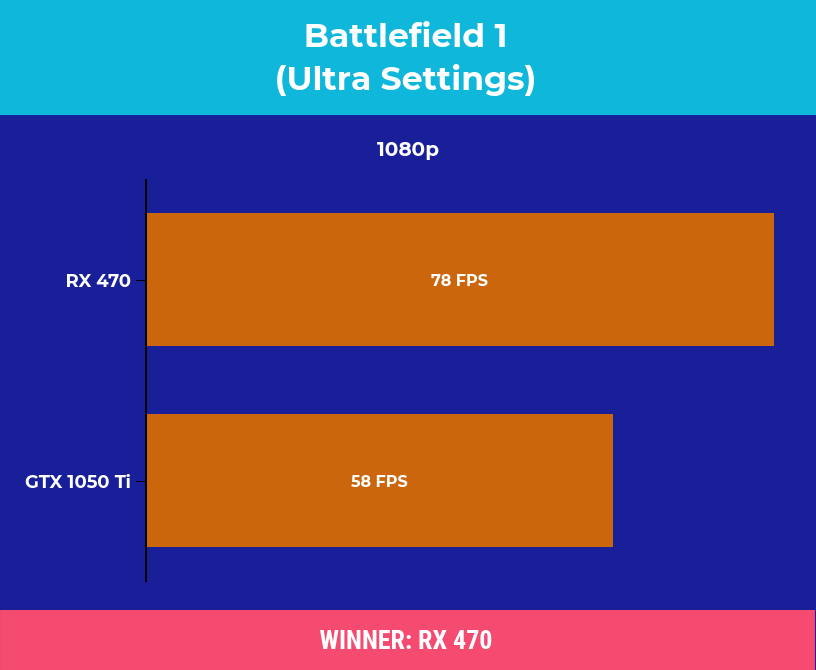
Battlefield 1 is a resource intensive game and was tested with ultra settings. In my opinion this one doesn’t need a high frame rate to play, I can get by with a solid 60 FPS, so the 1050 Ti was a little behind here while the RX 470 played fine.
Mass Effect: Andromeda
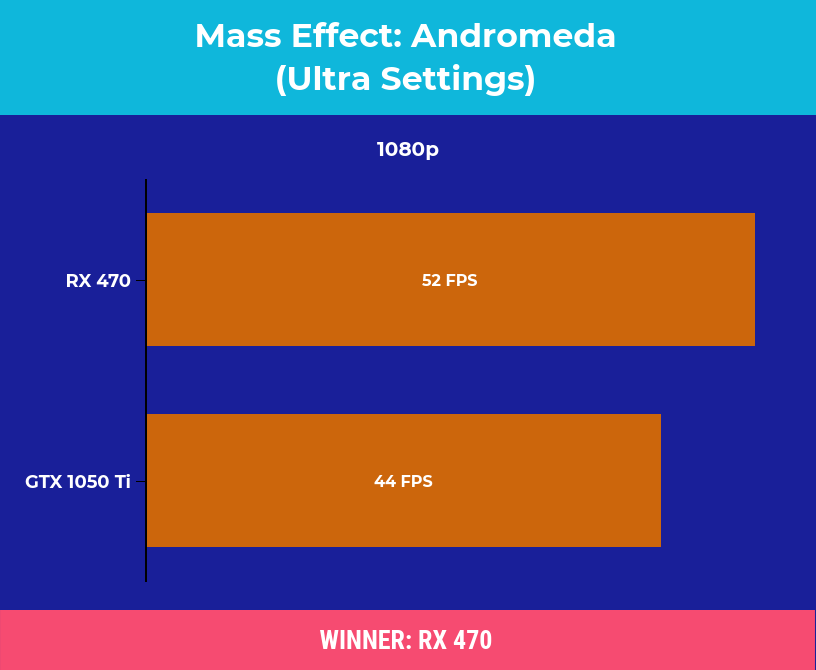
Mass Effect: Andromeda was tested with the built in benchmark and ultra settings in use, and is another resource heavy game. The RX 470 was 15% ahead of the 1650.
PUBG
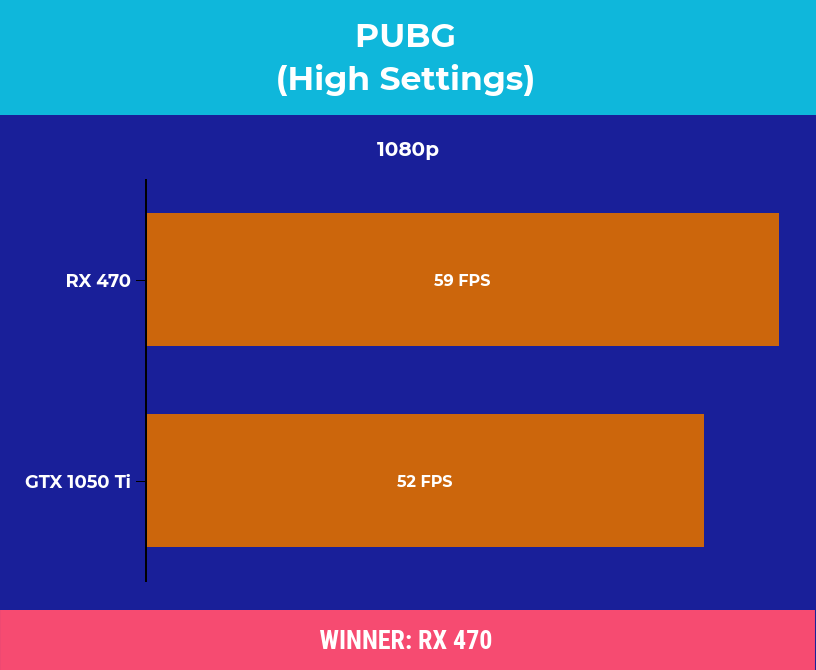
PUBG was tested with Hairworks disabled. At 1080p the RX 470 was achieving 11% higher average frame rates.
Rise of the Tomb Raider
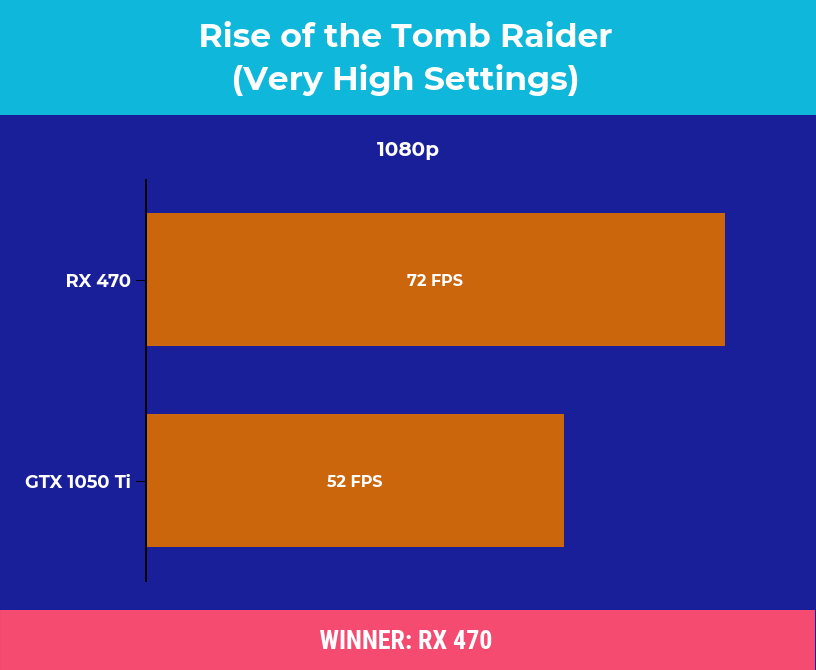
Rise of the Tomb Raider was tested with the built in benchmark using Vulkan and was at verry high settings. At 1080p the RX 470 was 27% ahead of the 1050 Ti in average FPS.
GTA V
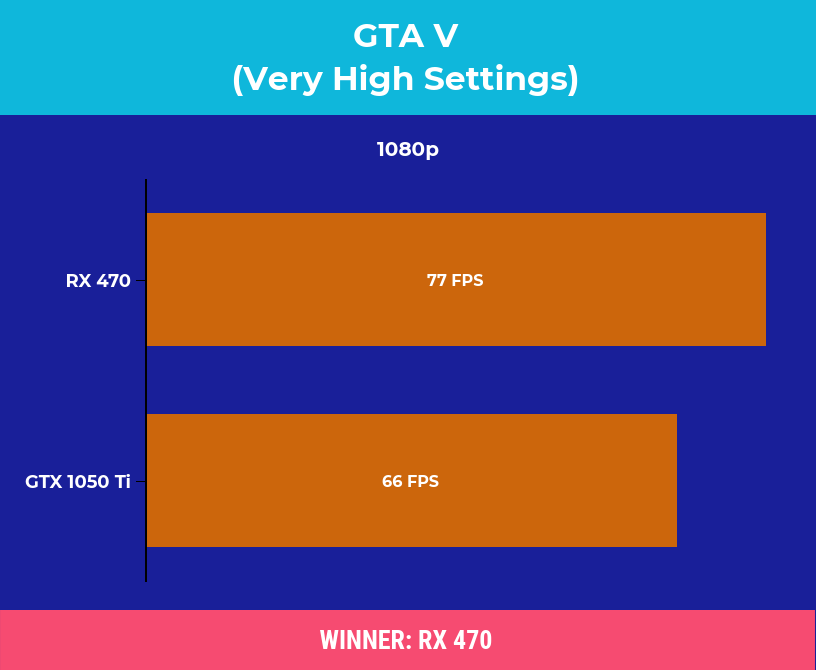
GTA V was tested with the built in benchmark. The RX 470 was 14% faster than 1050 Ti.
CONCLUSION
As you see the RX 470 is clear winner. GTX 1050 Ti was not even winning a single game. I will personally buy RX 470 in comparison of GTX 1050 Ti because there is not too much difference in price and it was performing much better than 1050 Ti. If you were buying today let me know which card you’d pick down in the comments and why, the GTX 1050 Ti or RX 470.
