| PROS | PROS |
| Best GPU performance on the market. Excellent cooling performance. Great value for creative professionals. Set it and forget it 4K gaming. | Biggest Navi. Decent overclocking. Does well in certain Proviz workloads. |
| CONS | CONS |
| Extremely expensive. Very large card. | Not that different from 6800 XT. Extreme pricing. Expect very limited quantities. |
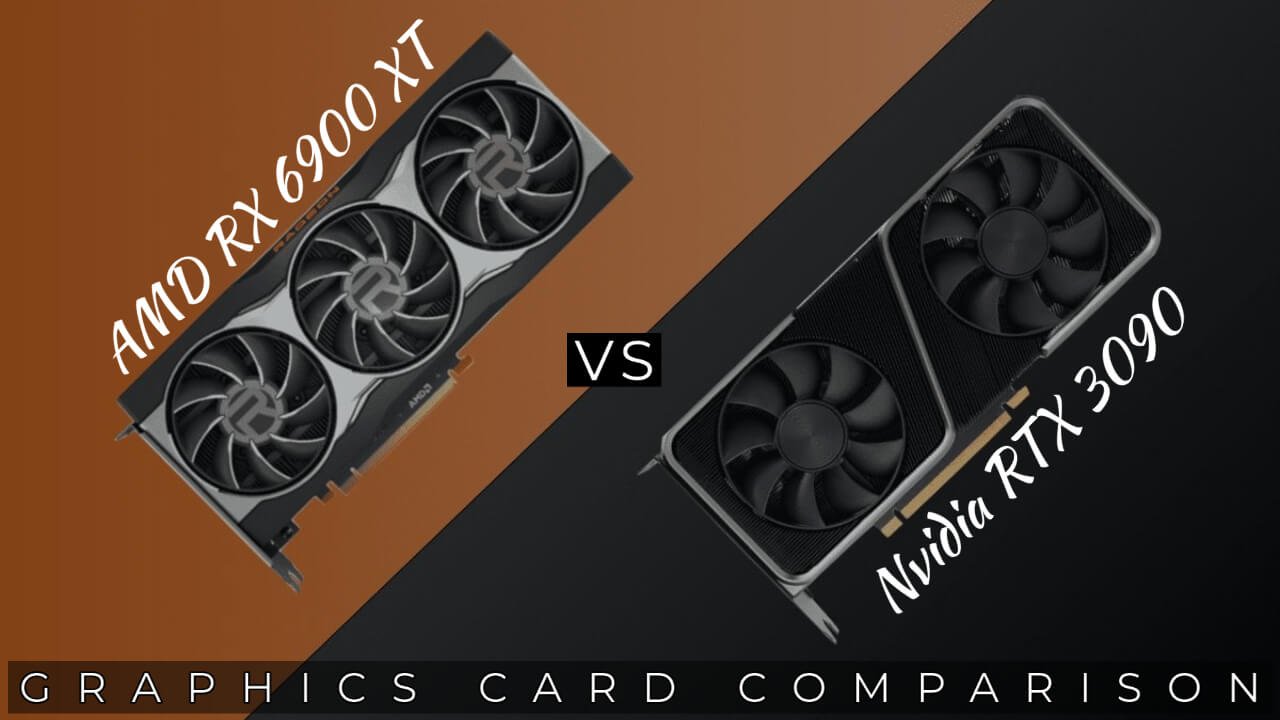
SPECS: RX 6900 XT Vs RTX 3090
| OVERVIEW | RTX 3090 | RX 6900 XT |
| Card Status | Official | Official |
| Manufacturer | NVIDIA | AMD |
| Release Date | 24th September, 2020 | 8th December, 2020 |
| Launch Price | $1499 USD | $999 USD |
| Board Model | NVIDIA PG136/PG132 | AMD D412 |
| GPU | RTX 3090 | RX 6900 XT |
| GPU | 8nm GA102-300 | 7nm Navi 21 XTX |
| Cores : TMUs : ROPs | 10496 : 328 : 112 | 5120 : 320 : 128 |
| CLOCKS | RTX 3090 | RX 6900 XT |
| Base Clock | 1395 MHz | 1815 MHz |
| Boost Clock | 1695 MHz | 2250 MHz |
| Effective Memory Clock | 19496 Mbps | 16000 Mbps |
| Max Computing Pwr (FP32) | 35.58 TFLOPS | 23.04 TFLOPS |
| MEMORY | RTX 3090 | RX 6900 XT |
| Memory Size | 24576 MB GDDR6X | 16384 MB GDDR6 |
| Memory Bus Width | 384-bit | 256-bit |
| Memory Bandwidth | 935.81 GB/s | 512 GB/s |
| PHYSICAL | RTX 3090 | RX 6900 XT |
| Interface | PCI-Express 4.0 x16 | PCI-Express 4.0 x16 |
| Thermal Design Power | 350 W | 300 W |
This comparison is noteworthy because both graphics are focused at the highest levels of gaming, effectively making them the top-of-the-line gaming models that AMD and NVIDIA have to offer at the moment. Aside from that, two key points piqued my interest:
- It’s the first time in years that AMD has gone head-to-head with NVIDIA’s top performers. For example, the top-of-the-line model (RX 5700 XT) competed with the RTX 2070 Super rather than the RTX 2080 Ti in the previous generation.
- The price gap between these two GPUs is enormous. The RX 6900 XT has an MSRP of $999, compared to $1499 for the RTX 3090.
Both graphics cards are based on the latest architecture; AMD RDNA 2 and NVIDIA Ampere. They are also radically different in every way.
TEST SYSTEM SPECS:
Intel i9 10900K 3.7GHz – BUY HERE
MSI MPG Z490 GAMING PLUS – BUY HERE
CPU Cooler – Zalman CNPS10X Performa –BUY HERE
RADEON RX 6900 XT 16GB – BUY HERE
GeForce RTX 3090 24GB – BUY HERE
32GG RAM DDR4 3600Mhz – BUY HERE
Power Supply CORSAIR RM850i 850W – BUY HERE
SYNTHETIC PERFORMANCE: RX 6900 XT Vs RTX 3090

Synthetic performance tests are very interesting ways to compare the performance of two graphics cards with “single data”, against the rain of information that the combined graphics of several games suppose. However, they are not infallible sources, because as in games they are biased because they depend more or less on very specific aspects in which one graphic architecture can win over the other, in such a way that a graphic that in general is inferior may end up appearing superior thanks to these details.
Therefore, perhaps where they enjoy the greatest reliability is when we compare between models with the same or at least similar architecture. This is not the case, so we cannot just take the results of the synthetic tests, but we can take advantage of it to get an initial idea that we will later expand with the performance in games.
Well, in our analysis, different 3DMark synthetic tests have been used , where the results obtained have been the following:
| RX 6900 XT | RTX 3090 | 6900XT improvement (%) | |
| 3DMark Fire Strike | 54645 | 47183 | 15% |
| 3DMark Fire Strike ULTRA | 13343 | 12347 | 7% |
| 3DMark Fire Strike Extreme | 26445 | 23781 | 10% |
| 3DMark Time Spy (DX12) | 18361 | 20055 | -7% |
| 3DMark Time Spy Extreme (DX12) | 8815 | 10058 | -11% |
| 3DMark Port Royal (Ray tracing) | 9670 | 12906 | -24% |
That said, we see how the RX 6900 XT surprises in Fire Strike, becoming the best graphics on the market in this test. This is the first sign that this type of benchmarks are not infallible to check performance, especially if we go to Time Spy (based on DX12) where the tortilla is turned.
We also have performance data in Blender, to see how it performs in rendering. The result is 37.8 seconds for the “The Junk Shop” project, compared to 34.26 seconds for the RTX 3090 Founders Edition. The truth is that, despite being a lower figure, the 6900 XT surprises as it achieves it under OpenCL, and the 3090 does it using CUDA.
GAME PERFORMANCE: RX 6900 XT Vs RTX 3090

5 Games Tested at 4K Resolution With Highest Settings of Every Game.
1. Battlefield V
| RTX 3090 | 103 FPS |
| RX 6900 XT | 102 FPS |
Let’s start out with Battlefield V, which was tested with the game’s benchmark. There was only 1 or 2 FPS difference in both graphics card.
2. Red Dead Redemption 2
| RTX 3090 | 76 FPS |
| RX 6900 XT | 69 FPS |
Red Dead Redemption 2 is a game that tends to favor Nvidia graphics, and sure enough the RX 6900 XT was also doing better. Nvidia is only 7 FPS ahead.
3. Assassin’s Creed Valhalla
| RTX 3090 | 62 FPS |
| RX 6900 XT | 67 FPS |
Assassin’s Creed Valhalla on the other hand is a game that tends to favor Radeon graphics. RX 6900 XT was around 8% ahead. Though it was just 5FPS difference.
4. Forza Horizon 4
| RTX 3090 | 144 FPS |
| RX 6900 XT | 149 FPS |
Forza Horizon 4 shows us what the 16GB of VRAM on the RX 6900 XT is stronger than 24GB on the RTX 3090. I was not excepting this; but yeah! AMD is the winner here with the lead of 5FPS.
5. Horizon Zero Dawn
| RTX 3090 | 79 FPS |
| RX 6900 XT | 76 FPS |
Horizon Zero Dawn was doing better with the RTX 3090 graphics. The 3090 had a 3.7% higher average frame rate here, or about 3 FPS.
CONCLUSION: RX 6900 XT Vs RTX 3090
In conclusion, the RX 6900 XT is now considered a superior option than the RTX 3090 for anyone who values the enormous $ 500 price difference over ray tracing, the use of DLSS, or the 3090’s bigger memory VRAM. Maybe, NVIDIA will develop a better-positioned competition to the 6900 XT.
